Where and how companies disclose board composition information
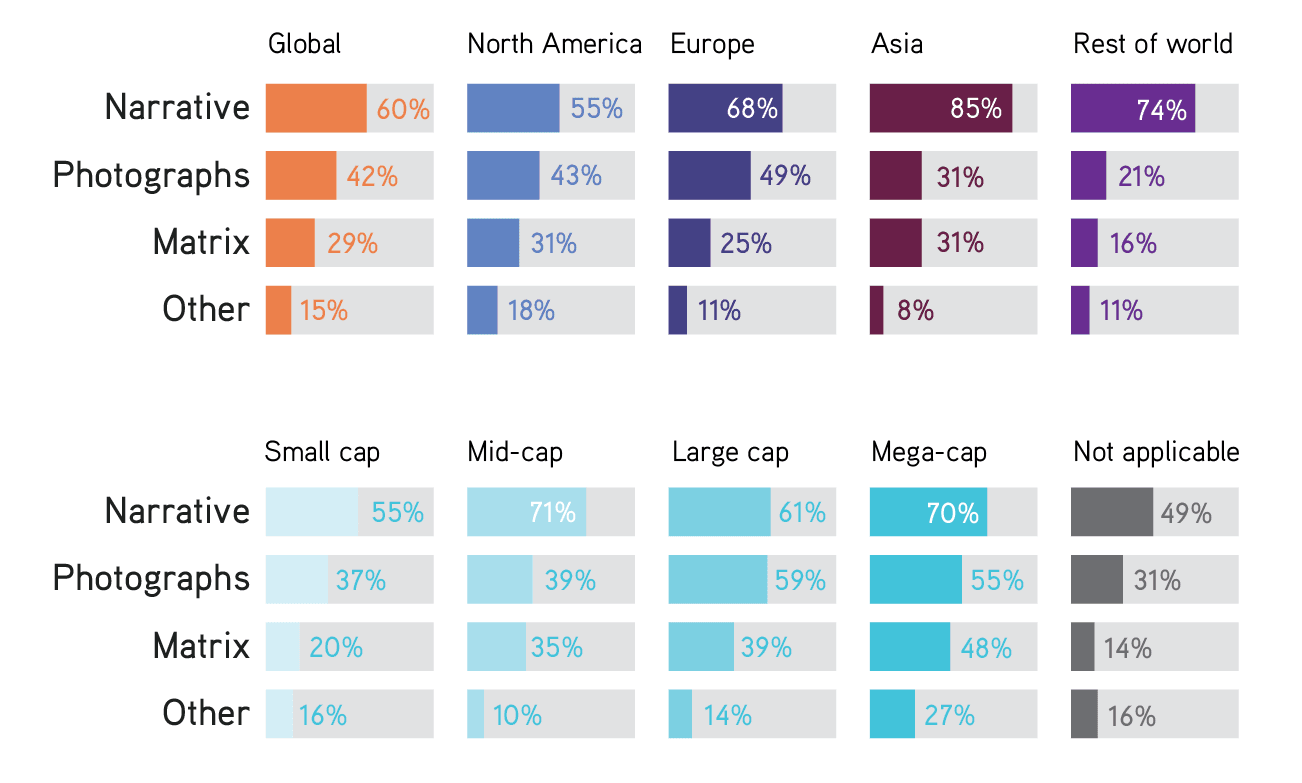
The most common format cited by respondents for presenting board diversity information is ‘narrative’ (60 percent). Photographs are used by 42 percent of respondents and a matrix by less than a third (29 percent). Respondents in Asia are more likely to use a narrative format (85 percent) than those in Europe (68 percent) or North America (55 percent). Those in Europe are more likely (49 percent) to use photographs than those in North America (43 percent) or Asia (31 percent).
Respondents at mid-caps (71 percent) and mega-cap companies (70 percent) are more likely to use a narrative than those at small or large-cap companies (55 percent and 61 percent, respectively). A greater number of respondents at large and mega-cap companies use photographs (59 percent and 55 percent, respectively) than do respondents at small or mid-cap companies (37 percent and 39 percent, respectively).
Respondents at larger companies are more likely to use a matrix to present board diversity information: just a fifth (20 percent) of those at small caps use a matrix, compared with 35 percent of those at mid-caps, 39 percent of those at large-cap companies and almost half (48 percent) of those at mega-caps.
Among respondents who use other formats, examples cited include director biographies, statistics and a variety of charts and graphs.
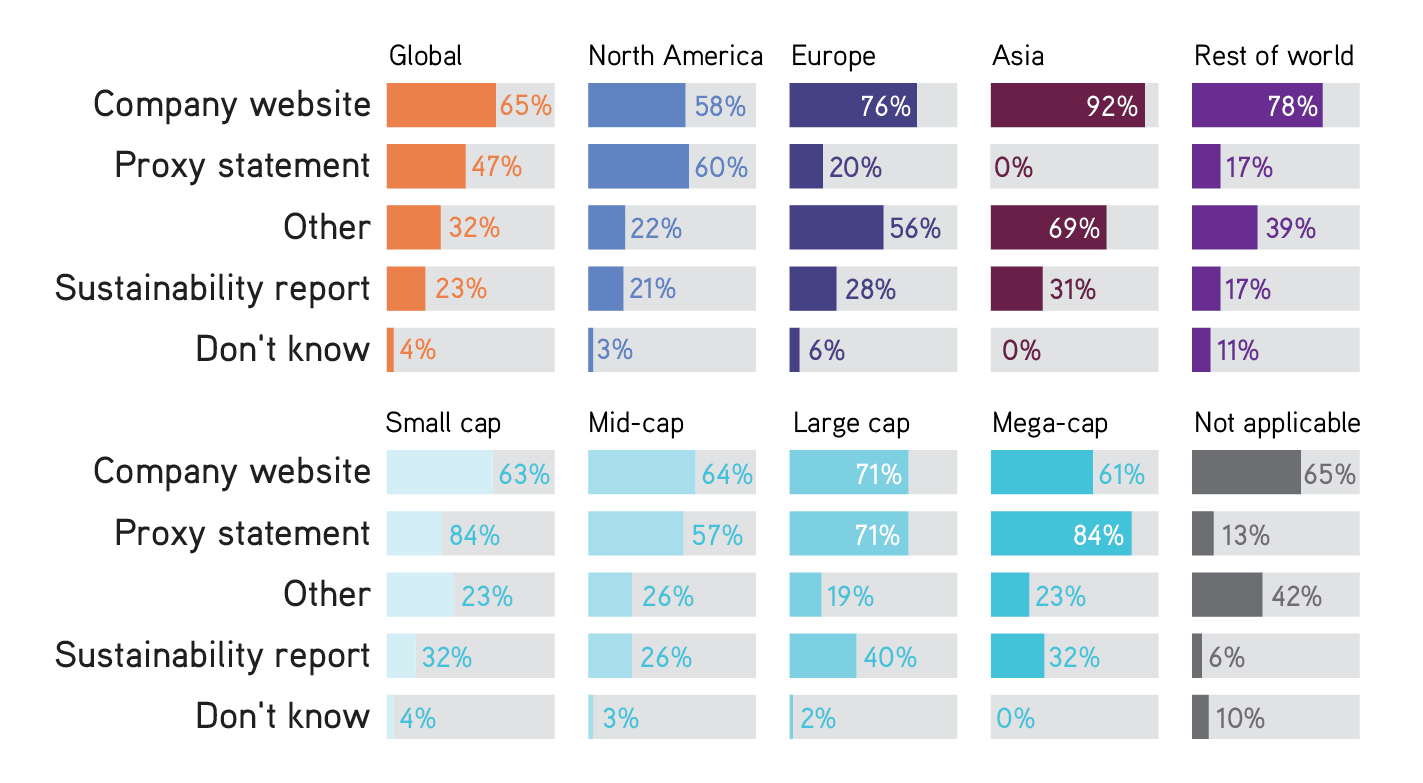
The most common way to release board composition information – cited by 65 percent of all respondents – is on the company website. Almost half of all respondents (47 percent) say they include that information in their company’s proxy statement. But while 60 percent of respondents in North America mention their proxy statement, only 20 percent of those in Europe and none of those in Asia do so. Globally, 23 percent of respondents say they disclose via a sustainability report.
Respondents at larger firms are more likely to include board diversity information in their proxy statement. The number increases from a third of respondents at small-cap companies to 57 percent of those at mid-caps, 71 percent at large-cap companies and 84 percent at mega-caps.
Among respondents who disclose board composition information in another place, the majority cite their annual report.